Better Performance through analysis
Please note I wrote this on my phone driving 6 hours, so I hope to update in more detail. Fun fact I now know how to do git remote recursive from Android ????
The current web standard for initial page load is 2.0 seconds. This is only part of the performance story. Let’s dive in a little deeper and see how else we can improve performance. In terms of data reduction and user experience, sometimes these things are not as noticeable.
Web.dev
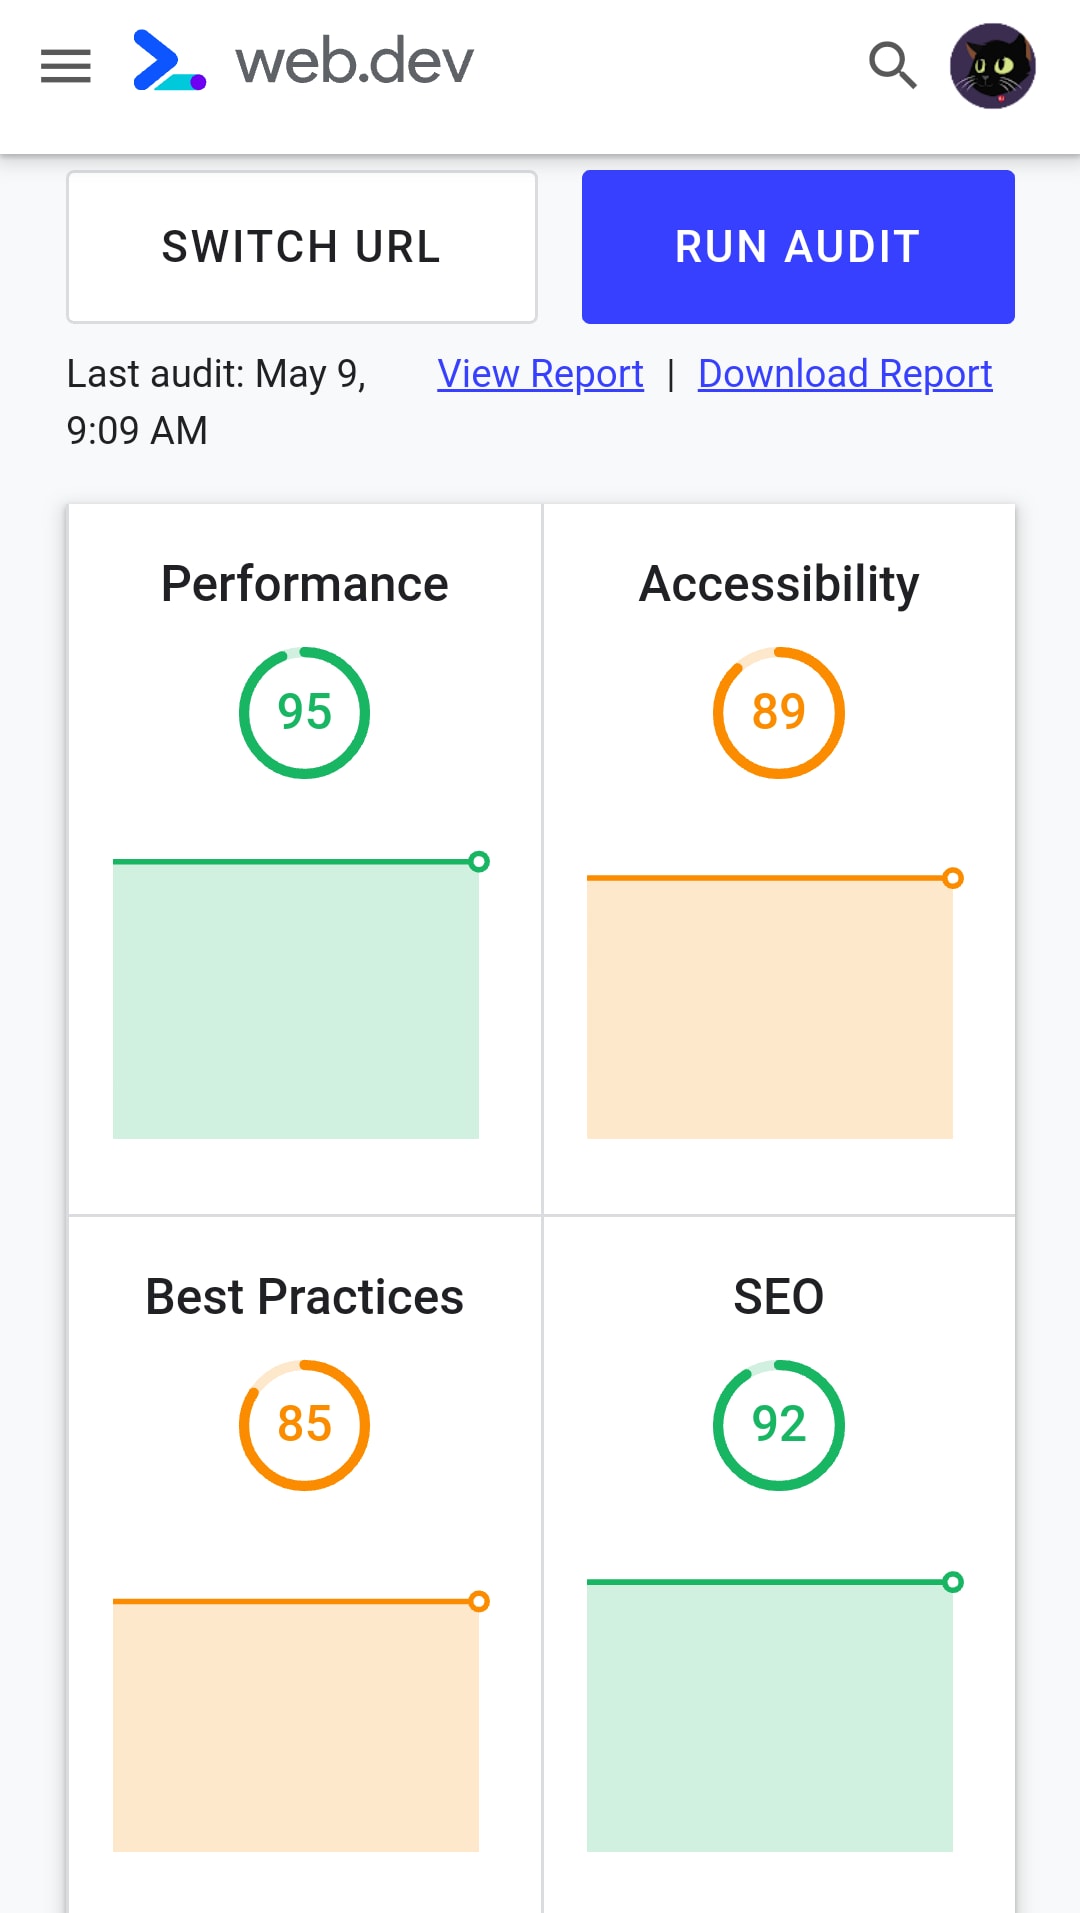
Web.dev learning is one of the best sources to increase performance on your site.As you can see in the video, they have several subjects to help improve your sites performance.I actually find myself using the measure feature prior to diving into the learning section. But I never was good at “hitting the books” in school, I am a visual hands on learner ????.It is nice to repeat the lighthouse metrics to see what you have learned and the trends over time.
Firebase performance monitoring
Firebase Performance Monitoring docs have the best information possible. With that said there are three key elements:
- Automatically measure app startup time, HTTP/S network requests, and more
- Gain insight into situations where app performance could be improved
- Customize Performance Monitoring for your app
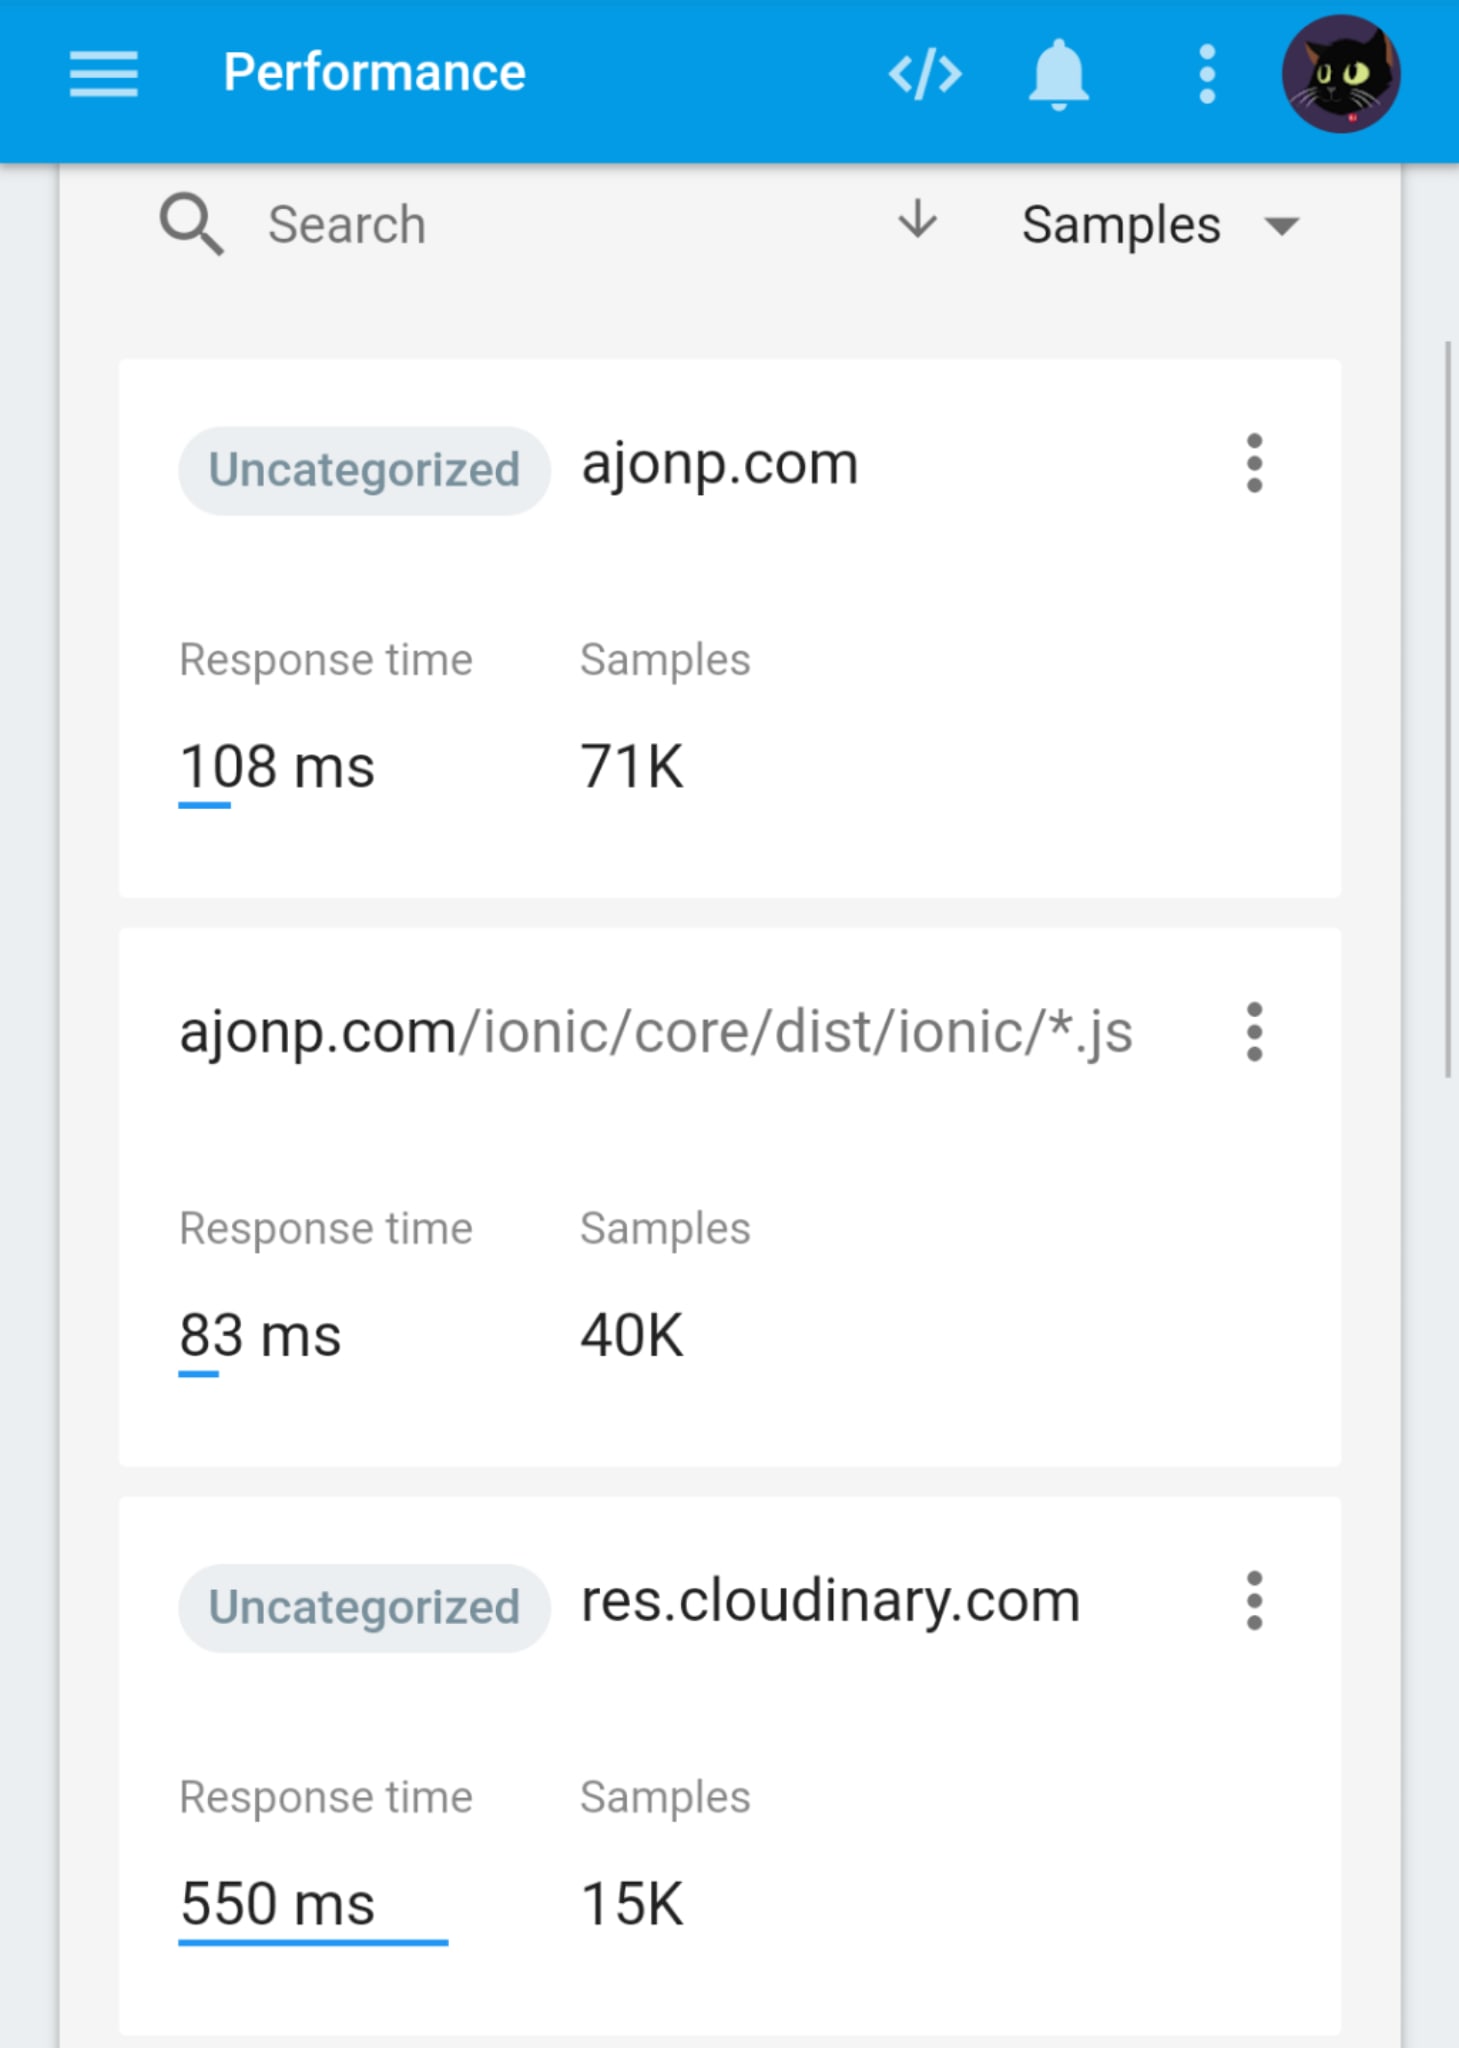
The awesome part of Firebase is that it is a very small amount of code that gives you all of this great info!Here you can see a great overview
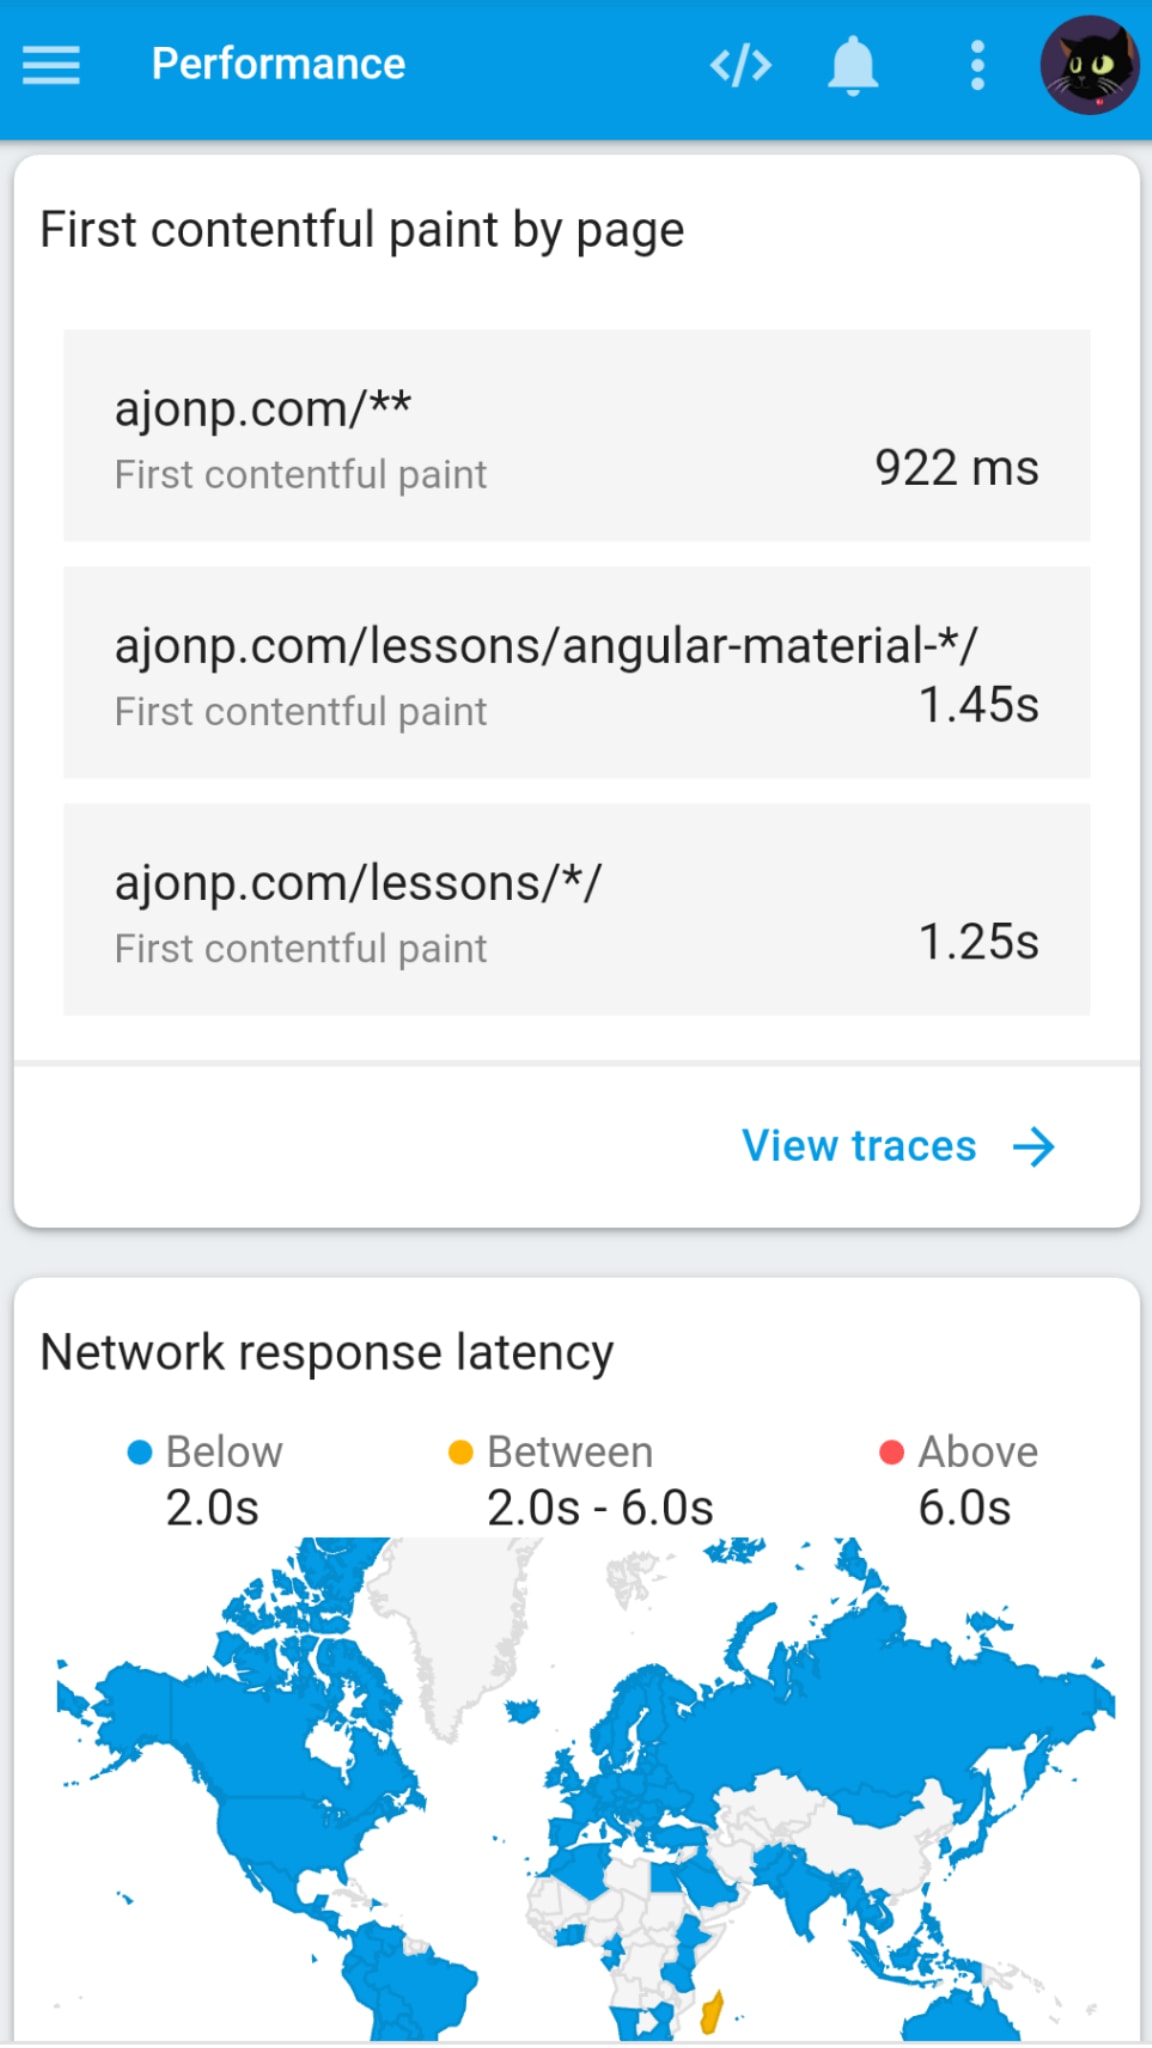
You can see all the pages and how many samples determine the average performance.
Why 2 seconds
Google ranks search results higher based on many inputs to the algorithm, speed is one of the most important factors! Now if you want to go beyond that checkout Google’s Performance blog.
User perception matters
You really need to make all pages feel like less than one second, why? Humans can’t perceive things much faster than one second, but past that they start to think things are wrong. Google cares about the user and uses the RAIL method.
- Response - How quickly browser reacts
- Animation - effects that make a site look good
- Idle - Settling down so browser does not have to process
- Load - How quick does this page load
Additional tools
As Google’s post points outChrome DevTools The developer tools built into Google Chrome. Provides in-depth analysis on everything that happens while your page loads or runs.Lighthouse Available in Chrome DevTools, as a Chrome Extension, as a Node.js module, and within WebPageTest. You give it a URL, it simulates a mid-range device with a slow 3G connection, runs a series of audits on the page, and then gives you a report on load performance, as well as suggestions on how to improve. Also provides audits to improve accessibility, make the page easier to maintain, qualify as a Progressive Web App, and more.WebPageTest Available at webpagetest.org/easy. You give it a URL, it loads the page on a real Moto G4 device with a slow 3G connection, and then gives you a detailed report on the page’s load performance. You can also configure it to include a Lighthouse audit.
Difference on what you test
If the majority of your users are on desktop, you probably care more about testing for desktop. However, if you are looking to build a broader user base, especially in developing world’s, you better check low end mobile results!
Desktop for AJonP
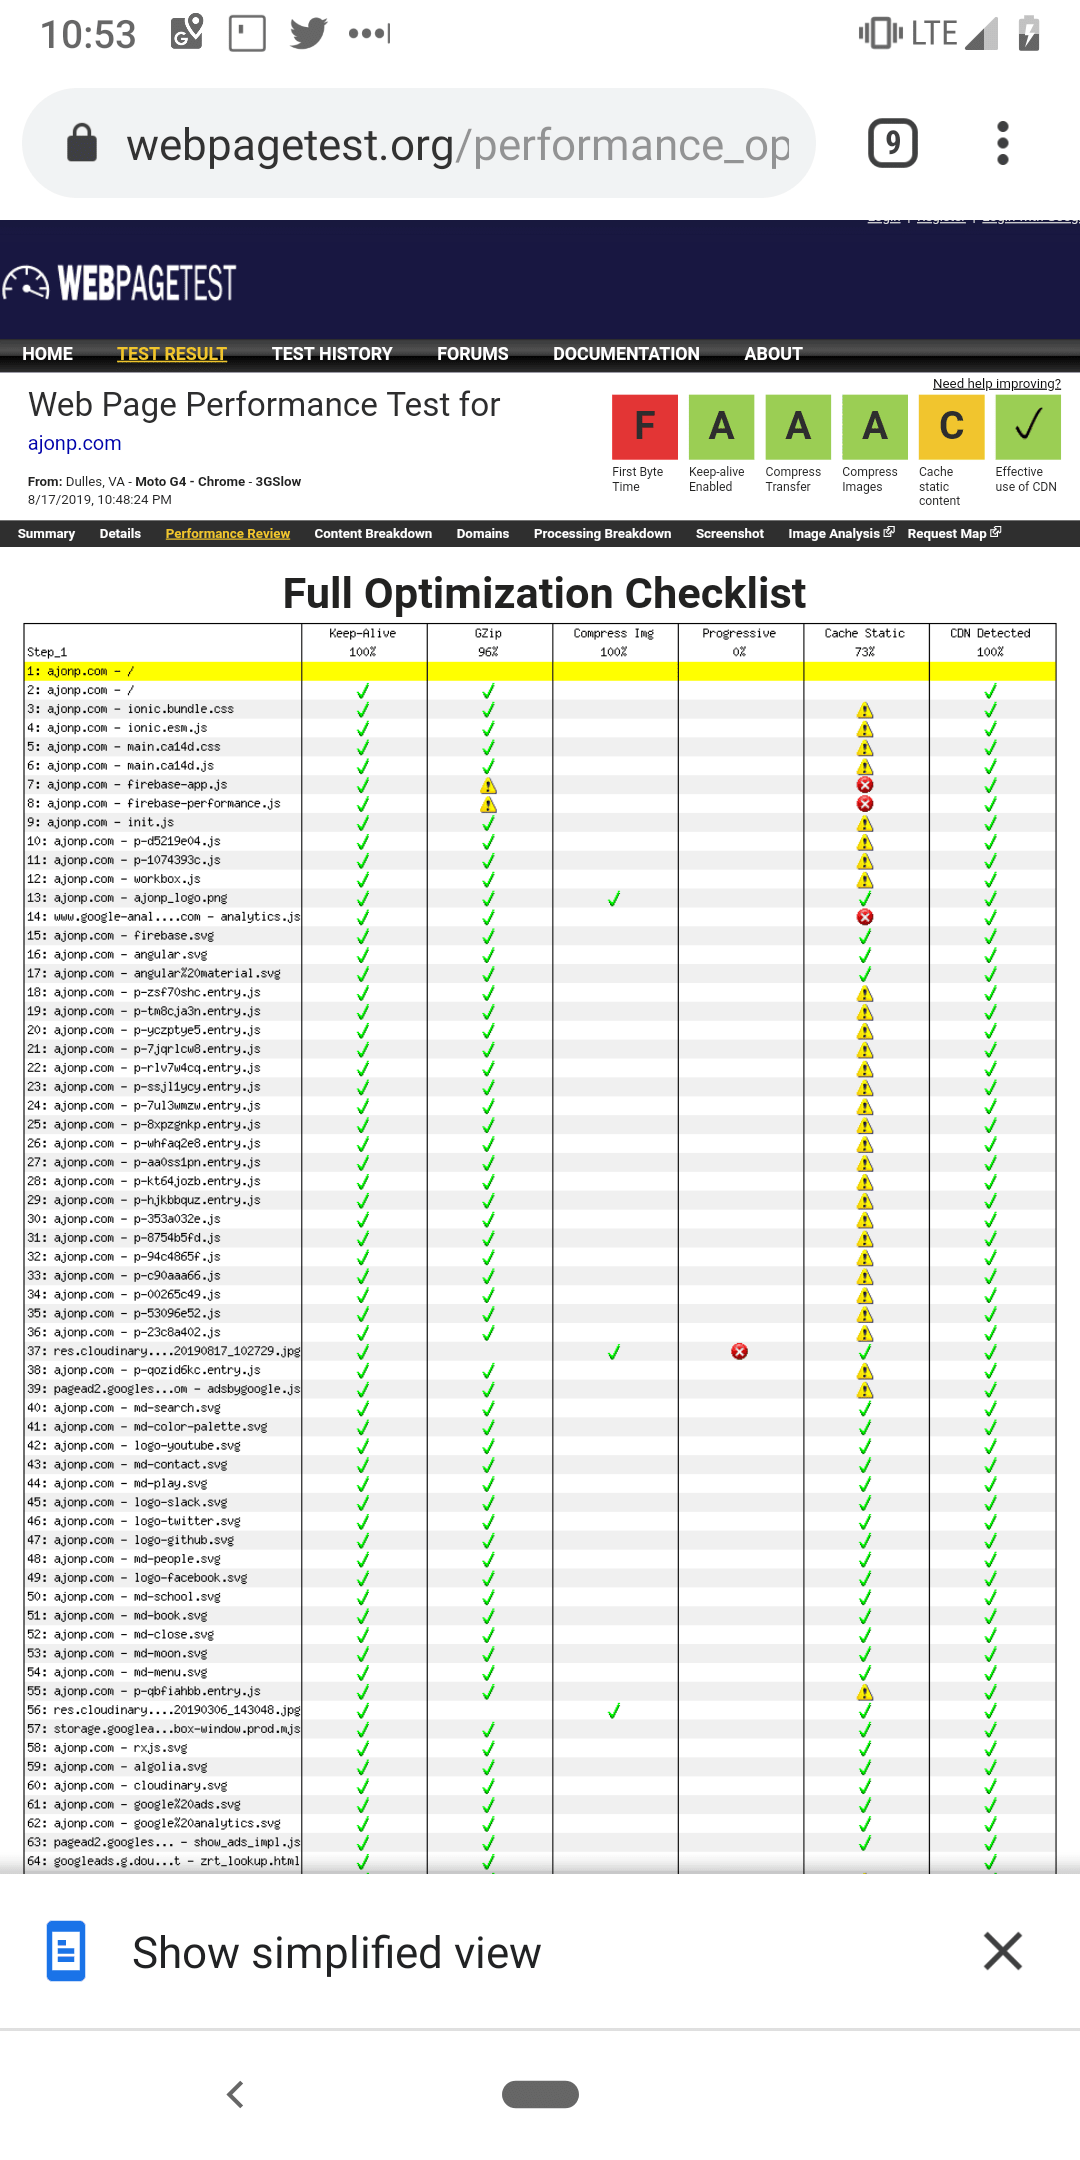
I try to get an all A rating, but this shows even smaller items that you can fix.
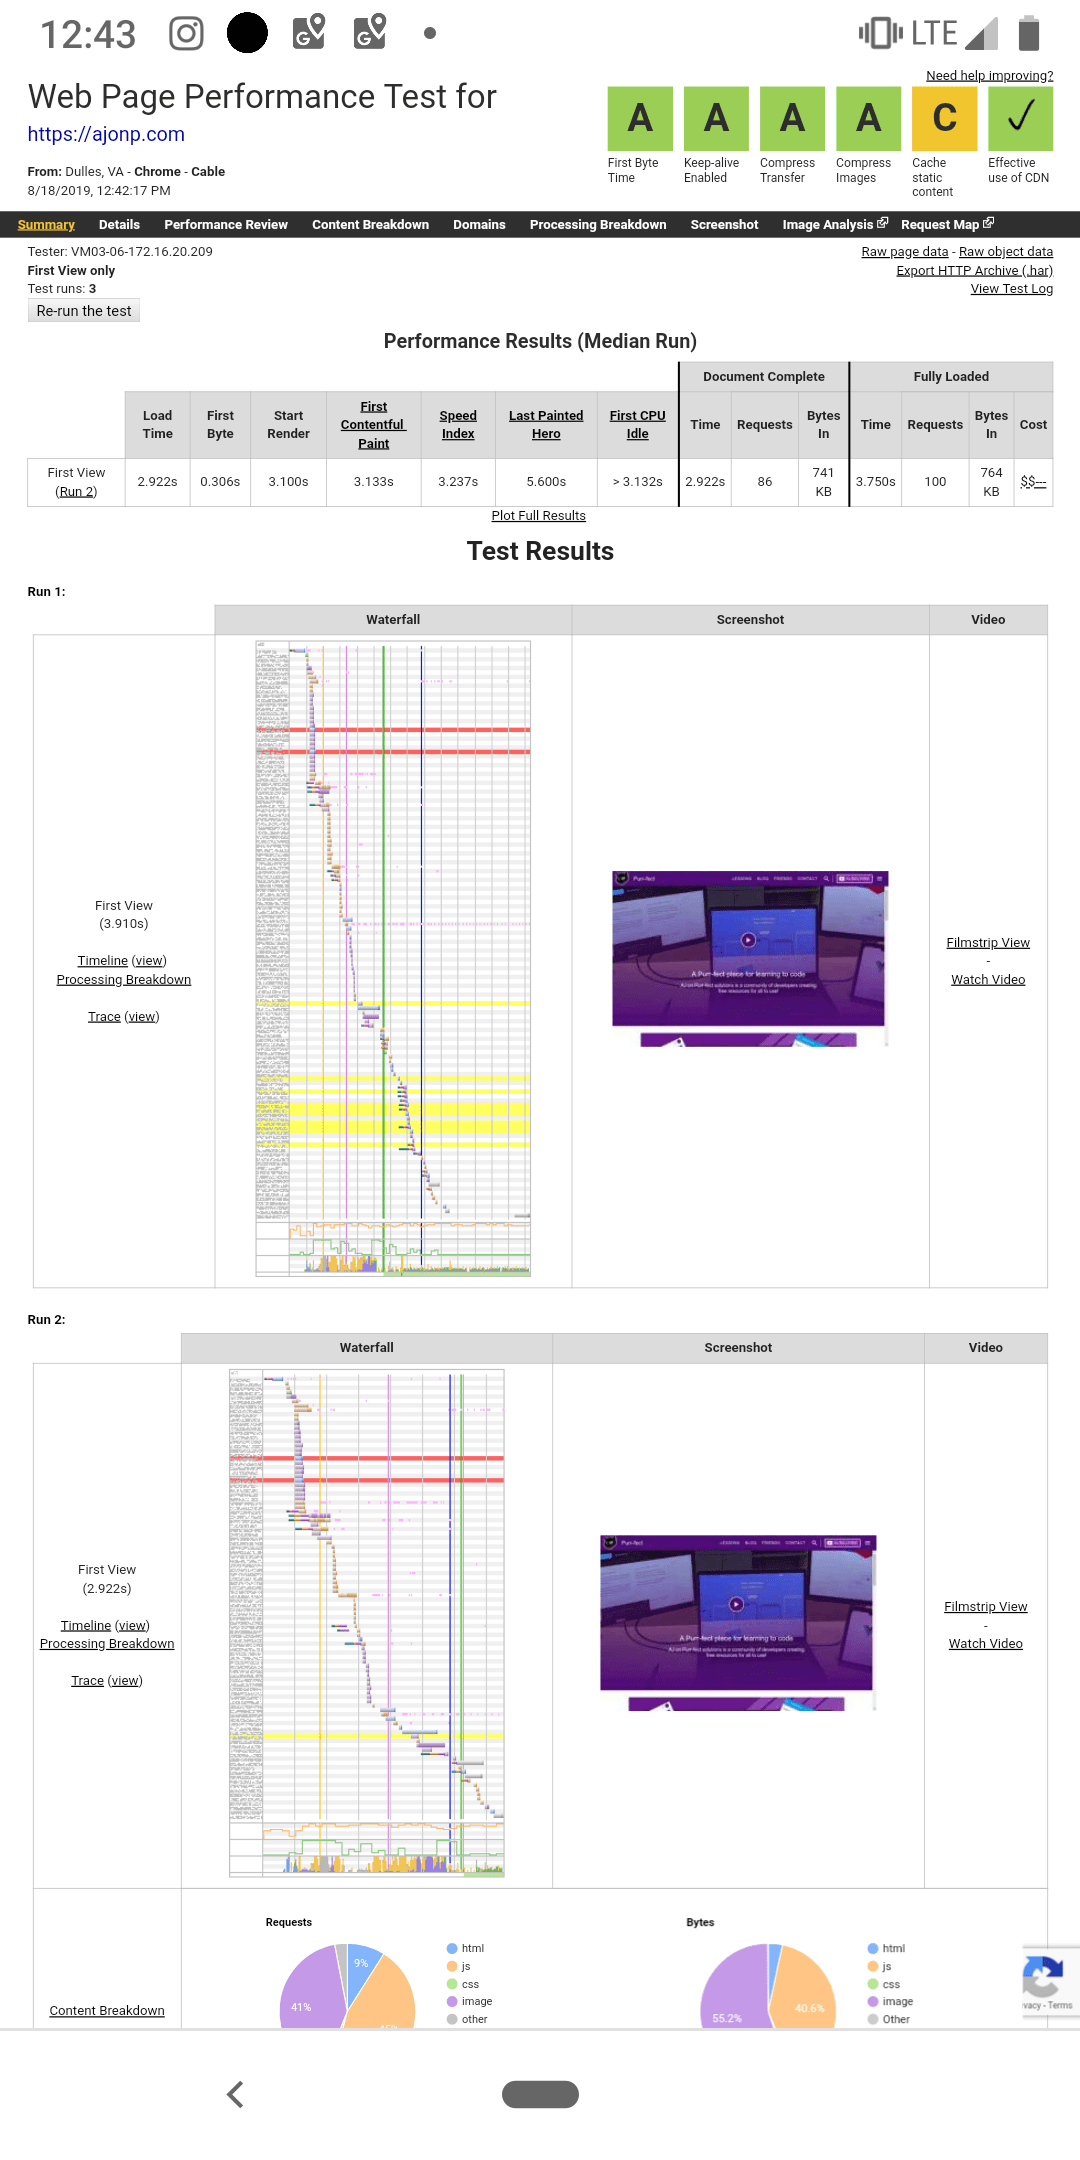
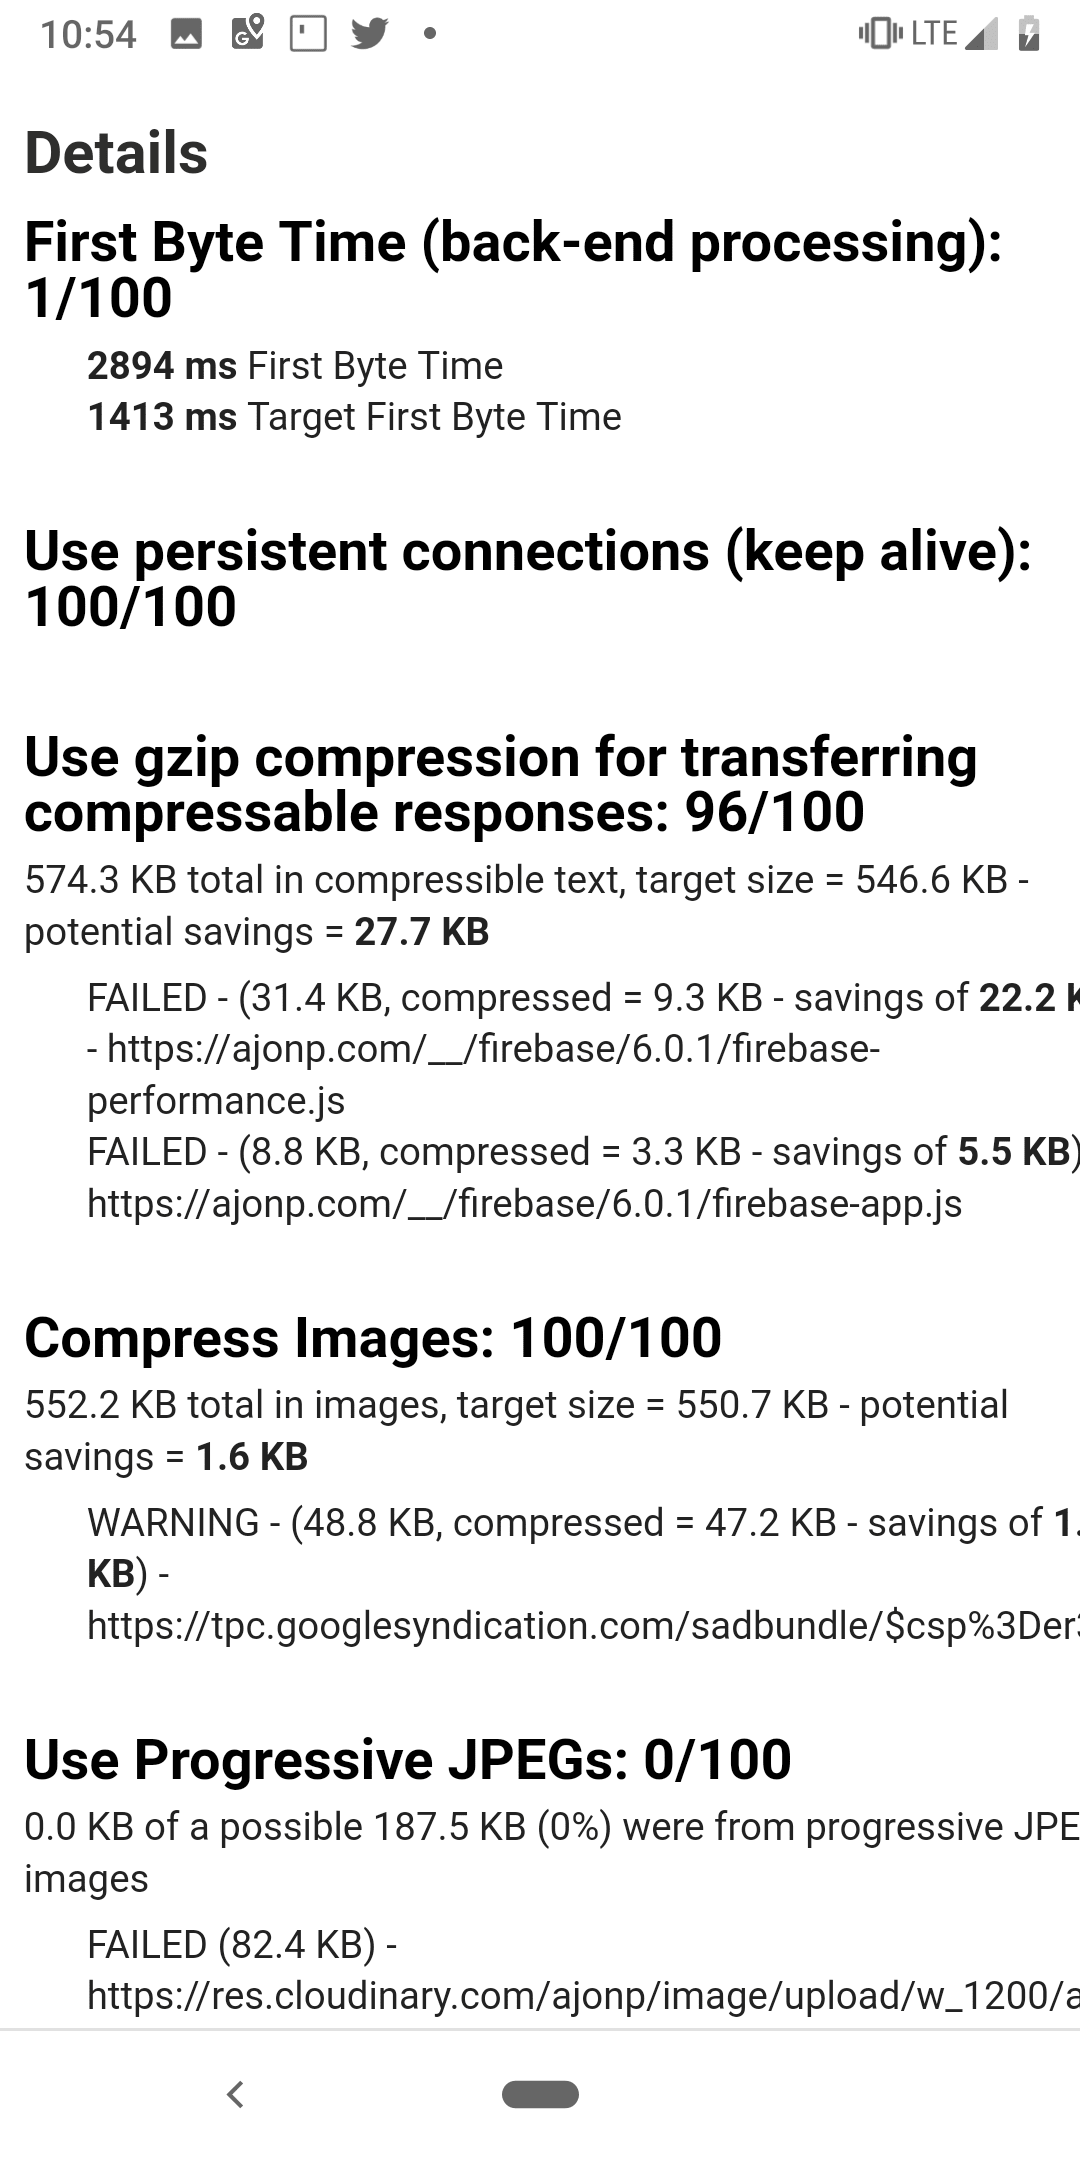
It allows you to really dig down into the details.
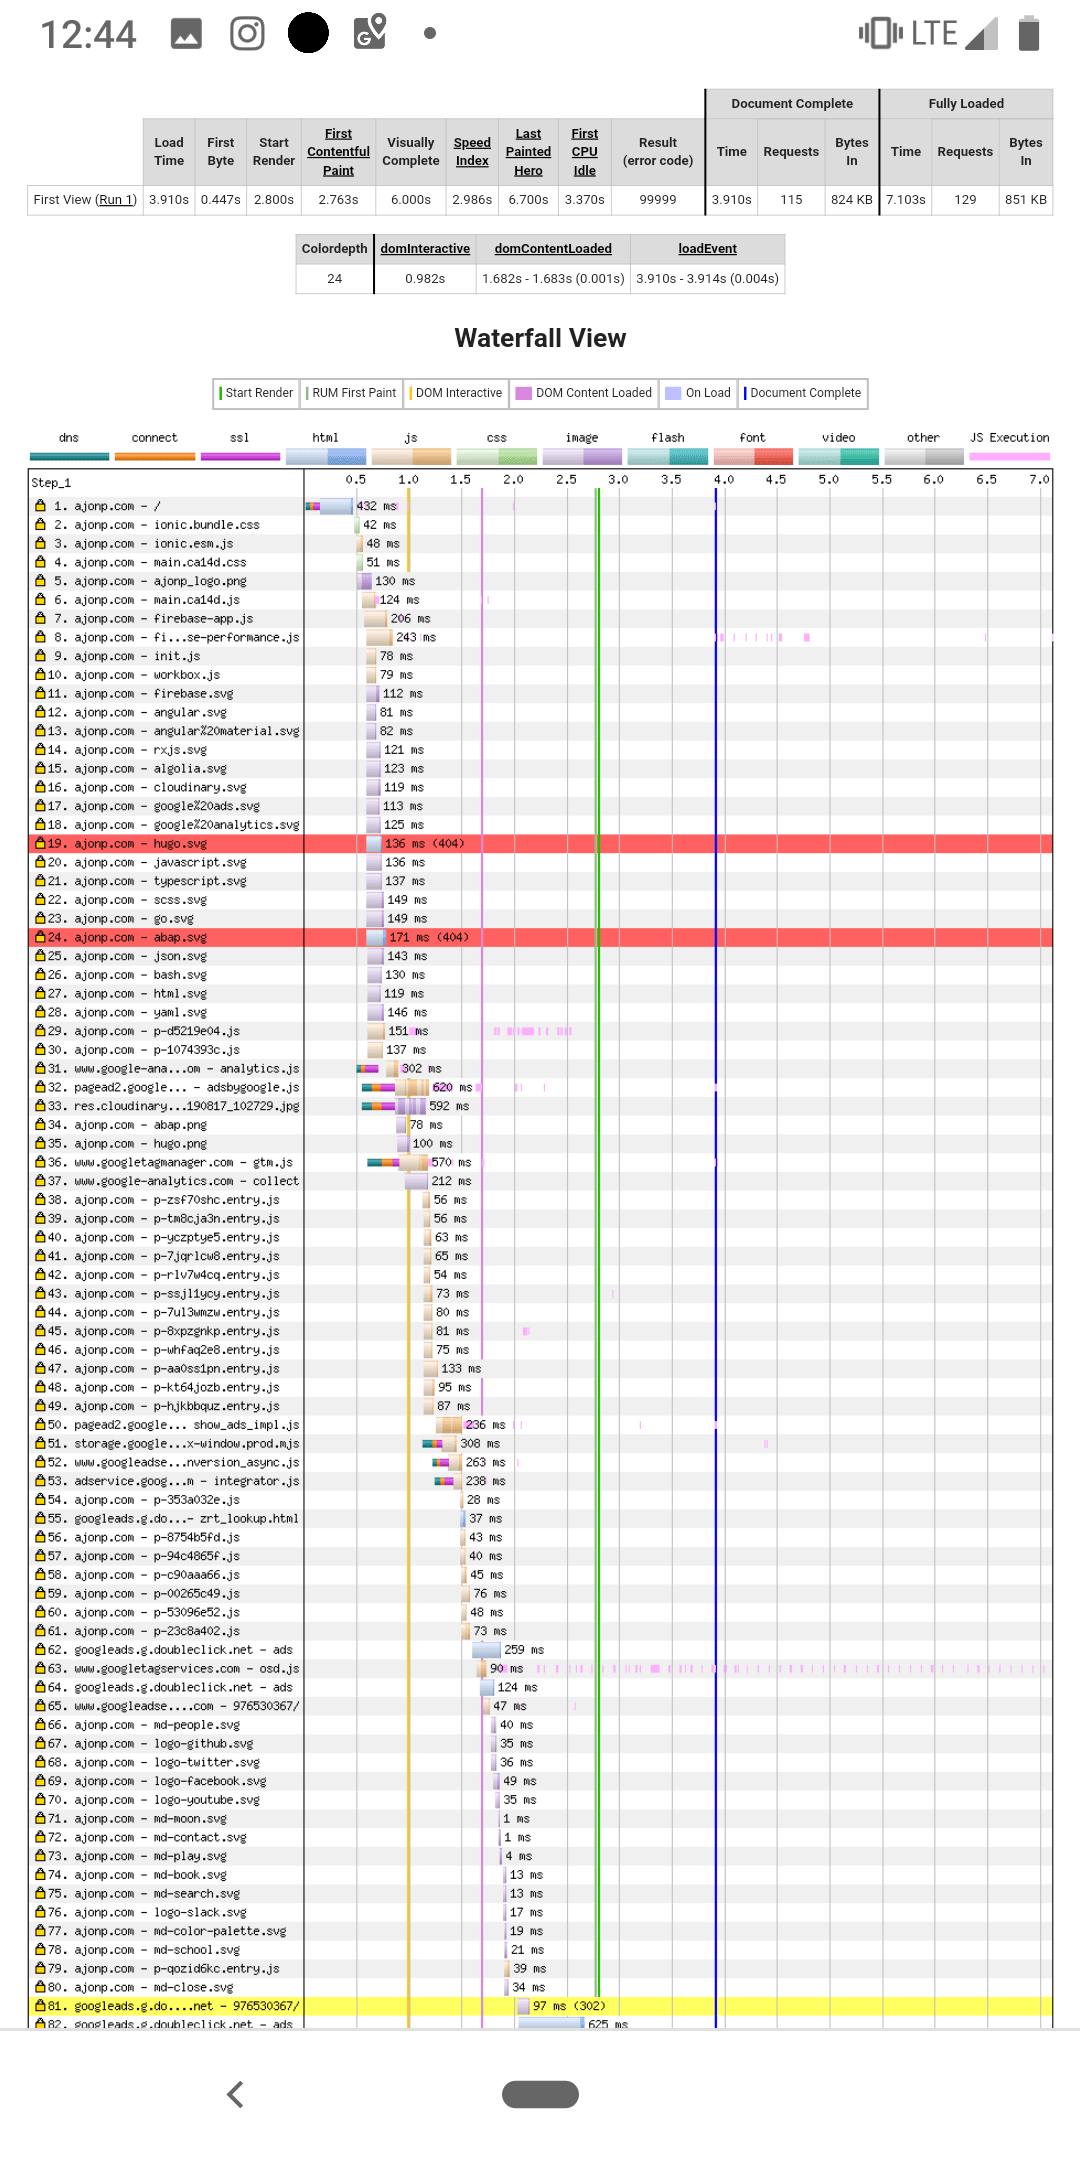
Mobile low-end for AJonP
An example where I can improve performance still on low end devices.
